
| |
||
| |
||
| |
||
| |
|
|
|
|
Repeat: do not start in the top third of the chart. How to use this web service to measure equal loudness curves.
What does your hearing curve mean?Most people will find that their hearing is most sensitive around 1–4 kHz and that it is less sensitive at high and low frequencies. Children usually hear 16 kHz moderately well. The high frequency hearing of adults depends on age and exposure to loud sounds. It is not uncommon for adults to have very low sensitivity for the highest frequencies. (Your children may be complaining about that 16 kHz tone that you cannot hear.) If you cannot hear the lowest frequencies, it's probably because you are using loudspeakers. As we mentioned above, you need headphones that enclose your ears for this.How does your hearing response depend on loudness?The shape of your hearing response curve probably depends on loudness. For most of us, the curve is flatter at higher sound levels*. Choose a louder or softer reference signal and obtain a new curve. (If you reload the page it will clear the old curve from the screen.)Can you use this web service to measure hearing threshold curves?It is possible, but not likely. Even if your headphones seal really well around your ears, they will probably only give you about 20 to 25 dB insulation from the external sound field. Human hearing thresholds can be around 0 dB in the frequency range 0–4 kHz. It is rare to find an office whose sound level is as low as 20 dB – i.e. an office in which 20 dB of insulation would reduce the sound level to near threshold levels. For a start, your computer probably has a fan and a power supply that raise the sound level above 20 dB, even at these frequencies. There may be other background noise as well. However, under very good conditions (a really quiet, still environment, no computer fan or other stray noises) it might be possible.If so, the method would be to find the lowest sound level audible at each frequency. (How this level relates to the common standard of sound levels (see What is a decibel?) is something that we cannot tell you: it depends on the gain of your sound card and headphones. However, see the note about calibration below.) Under normal conditions, if you seek the lowest sound level you can hear at each frequency, what you will find is the lowest level of a sine wave that is not masked by the background noise that you are hearing inside your headphones. What do levels on the measured curve mean? Zero dB does not mean zero sound. By definition, the reference level for zero dB is arbitrary. For the hearing curve you make with the gadget above, it is the maximum output of your interface card, amplifier and earphones with the current settings. (We do not know the specifications of your equipment, of course, and we don't know how high you have set the 'volume' knob.) Because we see 0 dB as the maximum loudness, all measurements will have levels below that, i.e. negative dB. See What is a decibel? for an explanation. For the graphs shown immediately below, however, 0 dB is a rms pressure amplitude of 20 µPa. 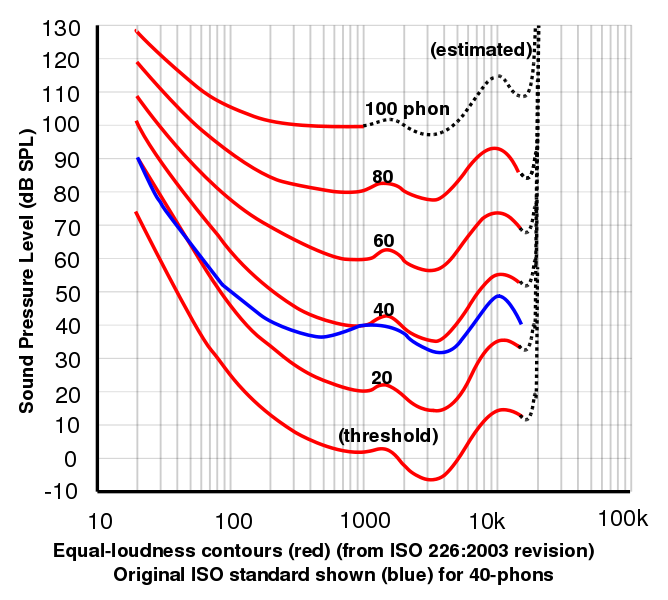
This graph, courtesy of Lindosland, shows the 2003 data from the International Standards Organisation for curves of equal loudness determined experimentally. Plots of equal loudness as a function of frequency are often generically called Fletcher-Munson curves after the original work by Fletcher, H. and Munson, W.A. (1933) J.Acoust.Soc.Am. 6:59. Calibration and improvements. It is possible to improve the accuracy of measurements made using this service by calibrating the response of your sound card and headphones, using a small microphone with good frequency response. (Microphones usually have much flatter frequency response than do speakers, so even a quite cheap electret microphone can be useful.) Connect the microphone to an oscilloscope or to the input of the sound card of a second computer. Using high but not painful sound levels, play sound files with the same amplitude (i.e. click on panels in the same row) and measure the variation in the recorded AC voltage for different frequencies. This works at low frequencies, but for the highest frequencies the sound level varies considerably within the headphone itself. Microphones often come with a calibration curve, or a sensitivity rating in volts/pascal. Using this you can convert the values measured with the microphone to the standard expressions of sound level, in dB with respect to 20 µPa. * The flattening of the hearing curve at high sound levels is sometimes referred to jokingly as the first law of hifi: if you turn it up it sounds better. If ever you compare hifi systems in a shop, vary the volume controls (and loudness control, if present). The sales staff are usually aware of this law, so, before you buy, make sure that you try turning the expensive one down so that it slightly softer than the cheap one. The original flash script was made by George Hatsidimitris with sound files by John Tann of the School of Physics, UNSW. John has posted an array of sound files over a range of sound levels and frequencies. Conversion of the Flash content to HTML5/CSS/Javascript by Jingmin (David) Li.
Related pages
|
|
|
|
|
Archive: below is the original Flash version of the test. Instructions for use are as above.
Do not start in the top third of the chart.
Repeat: do not start in the top third of the chart.