The Non-linearity of AAPS CCDs


Chris Tinney, UNSW. 19 June 2007
Summary
Both AAO laboratory test data and data acquired at the Anglo-Australian Telescope (either during detector commissioning, or during AAPS runs specifically for this purpose) have been analysed to quantify the non-linearity of the detectors used for AAPS observing.
These detectors (The MITLL2, MITLL2a, and EEV2 detectors) used in combination with the AAO1 and AAO2 controllers all show non-linearity at a measurable level. These levels of non-linearity have been quantified during laboratory tests at Epping and at the AAT, and are parametrised on the AAO WWW pages (see below for links) via a linear "alpha" parameter. As I have shown before (see eg. WFI Performance page with characterisations of the MITLL CCDs installed in WFI), this linear parameter is rarely a good parametrisation of non-linearity, and we find the situation is no different for the MITLL and EEV detectors used in UCLES since 1999.
Unfortunately, the laboratory data acquired to determine non-linearity is not ideal for measuring non-linearity, and the failure of the MITLL2 and MITLL2a detectors means they are no longer available to re-obtain better data. I have done the best below with the data in hand. The situation is much better for the EEV2 detector, which I have been able to characterise in detail using data acquired in June 2007.
I have been able to show that non-linearity is independent of read-speed, or controller used. This means that so long as the detector gain is known to high accuracy, one can use a non-linearity correction from one speed, to correct data at another speed. And a correction obtained with the AAO2 controller to correct data taken with the AAO1 controller. (This also means that while the work done here has been to aid the AAPS, these corrections can be used by any AAT observer to correct their data taken with these detectors at any speed).
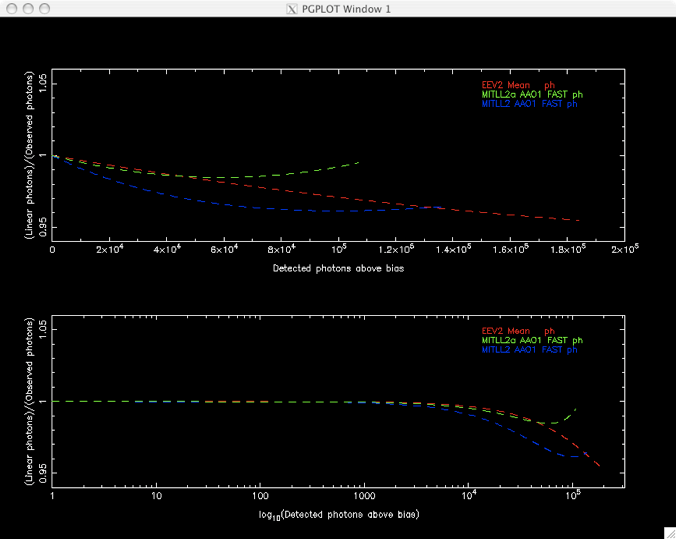
Recommended corrections for the AAPS detectors are collected at the end of this report, but the figure below summarises those results, presenting those non-linearity parametrisations for the three detectors, as a function of detected photons.


AAO Lab data for Non-linearity
This data is acquired using a purpose built test bench, which allows CCDs to be illuminated by sets of LEDs. Data sequences of different illumination times (originally obtained with different shutter open times, but more recently obtained by flashing the LEDs on-and-off themselves) are acquired, and can be used to look at the detector response as a function of illumination level.
Unfortunately (presumably to save time on the test sequences), these are carried out in three separate runs, with more LEDs illuminated on each run. So a sequence of exposures from 0.1s to 5s with one LED probes low count-rates, another sequence from 0.1s to 5s with more LEDs probes higher count-rates, and another sequence from 0.1s to 5s with even more LEDs probes linearity up to either detector full-well, or analog-to-digital converter cut-off at 65535adu.
Combining these three separate "chunks" of data means determining an individual count-rate for each set of LEDs. Because no calibration exposures are interspersed into these sequences, we have to assume the LEDs have constant brightness (with time) and I can't use exposures of fixed time in regions of overlapping illumination to get a really good normalisation between chunks. I have developed a moderately sophisticated way of doing this with the data itself, that involves fitting linear parametrisations to the data at the over-lap regions in illumination between chunks (or near the overlap regions where there is no overlap. Nonetheless there are systematic uncertainties added by the process of re-normalising between chunks. These add uncertainties to the final non-linearity measures, and impact on our ability to fit believable higher-order linearity corrections.
Having said which I have such lab data for every CCD and for every controller. (Though finding the MITLL2 and MITLL2a data "archived" at the AAT on a palette with about 100kg of other printouts in the corner of the aluminising room on the 2nd floor was a bit of luck).

AAT Linearity data
I routinely obtain linearity data whenever I do an astrometric program with a new detector, so I've adopted the same process with UCLES. Unfortunately, flat field lamps are rarely very stable, so you have to do a LOT of work to both make them as stable as possible (usually involving turning them on for hours before you want to use them), and calibrate the hell out of them by taking exposures of a fixed time throughout your sequence (sometimes as frequently as every second exposure).
This makes them time-consuming to acquire, and they then require quite some analysis, so these tests don't get done very often. Data sets like this have been taken at various times
-
•05-06 June 2007, EEV2+AAO2, FAST, NONASTRO, Tinney. Lamp calibratable to <0.05%
-
•24 April 2005, EEV2+AAO2, FAST, NONASTRO, Tinney. Lamp calibratable to <0.2%
-
•02 April 2001, EEV2+AAO1, FAST, Stathakis. Lamp calibratable to 0.04%, but full dynamic range not probed.
-
•18 July 2000, MITLL2A+AAO1, NONASTRO, Tinney. Lamp calibratable to just 0.5%.
-
•04 May 2001, MITLL2A+AAO1, NONASTRO, Tinney. Lamp calibratable to just 0.5%.
Of these data sets only the June 2007 and April 2001 data have been taken with the lamp being stable enough to derive decent linearity solutions. The other data can only be used (at best) to see whether it's consistent with solutions derived otherwise.

AAO Lab test results - the alpha parameter reported on AAO WWW pages
Sources :
Why alpha sucks
The linear parametrisation "alpha" assumes that your non-linearity (where Nm are "measured" counts and Nt are "true" or linear counts) is well parametrised by a linear function of the form
Nt / Nm = 1 - alpha *Nm
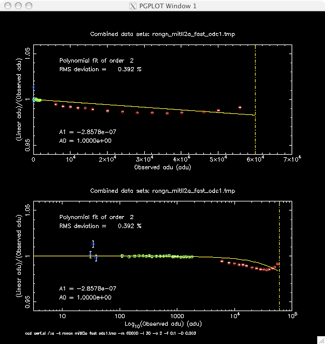
If alpha itself is very small, this may be a good approximation. However, I have never found this to be the case for any detector system I've actually characterised. Shown below are some example plots with some data and a linear "alpha" parametrisation fitted to them. Even when the total amount of non-linearity is small (ie ~ 1% as in the MITLL2a data shown on the left), alpha is still a poor parametrisation. When the non-linearity is large ~4-5% as on the right for MITLL2) it's criminal.


Detailed Test Reports

Recommended Linearity Corrections
Linearity corrections can be applied either on a 'photon basis' or 'adu basis' (in both cases photons or adus under discussion are those above bias). The photon corrections can be applied by multiplying your observed counts above bias by the gain to get a photon image, calculating the correction for each pixel and multiplying by it (and then dividing the gain back out again if you want the image back in adu again). The adu corrections can be calculated on a per pixel basis, and multiplied against the raw image on a pixel-by-pixel basis (after bias subtraction) directly. Conversions between photon and adu coefficients can be done easily with a bit of maths.
Note that for all three of these detectors the number of 'true' photons is smaller than the number of 'measured' photons. Unlike the case for HgCdTe infrared detectors (where this situation is reversed) CCDs can have non-linearities such that they both over-count and under-count. It depends on the detector and its amplifier and the way its being used (see for example the linearity of the Phase I and Phase II MITLL detectors in the RSAA/AAO WFI instrument, where CCD1 over-counts, and CCD4 under-counts), or Ivan Baldry's tests of the TEK CCD10 in the MSO 74", which over-counts.
Indeed we see both behaviours in the one device here with the MITLL2a! It overcounts more and more up to about 60000ph, then starts to trend back the other way, until it is essentially linear by 110000ph.
Photon corrections
Detector Range Notes Coefficients
(ph) (a0 a1 a2 ...)
EEV2 0-235000 1 1 -3.45119255147154e-07 5.40215125523544e-13
MITLL2a 0-110000 2 1 -5.19271046599947e-07 4.39571296506728e-12
MITLL2 0-130000 3 1 -9.88440043584435e-07 8.89397500240174e-12 -3.59983502729512e-17 7.24656871722611e-23
ADU corrections
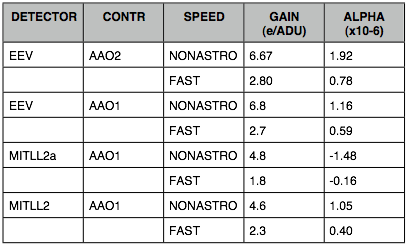
Detector+Cont+Speed Gain Range Notes Coefficients
(e-/adu) (adu) (a0 a1 a2 ...)
EEV2+AAO2+FAST 2.80 0-65535 4 1 -9.66333914412031e-07 4.23528658410458e-12
EEV2+AAO2+NONASTRO 6.67 0-24000 4 1 -2.30194543183152e-06 2.40335766979044e-11
EEV2+AAO1+FAST 2.7 0-65535 4 1 -9.31821988897316e-07 3.93816826506663e-12
EEV2+AAO1+NONASTRO 6.8 0-24000 4 1 -2.34681093500065e-06 2.49795474042087e-11
MITLL2a+AAO1+FAST 1.8 0-64000 5 1 -9.34687883879905e-07 1.4242110006818e-11
MITLL2a+AAO1+NONASTRO 4.8 0-23000 5 1 -2.49250102367975e-06 1.0127722671515e-10
MITLL2+AAO1+FAST 2.3 0-60000 5 1 -2.2734121002442e-06 4.70491277627052e-11 -4.37991927770997e-16 2.02788703639727e-21
MITLL2+AAO1+NONASTRO 4.6 0-23000 5 1 -4.74451220920529e-06 2.04917184055336e-10 -3.98112955338622e-15 3.84678013236225e-20


Notes
1 - The EEV photon correction is a mean correction derived from the three independent measurements reported on the EEV page. The largest deviation of any of the individual corrections from the mean is 0.1%, so I consider this mean correction to be extremely robust .
2 - The MITLL2a photon correction is that derived from the FAST data set reported on the MITLL2a page. Two data sets are available for MITLL2a, measured in FAST and NONASTRO. In the data range where they overlap, they give the same answer to within 0.5%, however, the FAST solution covers a larger dynamic range and so has been used to derive the recommended correction.
3 - The MITLL2 photon correction is that derived from the FAST data set reported on the MITLL2 page. Two data sets are available for MITLL2, measured in FAST and NONASTRO. In the data range where they overlap, they give the same answer to within 0.1%, however, the FAST solution covers a larger dynamic range and so has been used to derive the recommended correction. Note that this is a fourth order polynomial (the others are all quadratics).
4 - The EEV adu corrections are the mean EEV2 photon correction converted back into the coefficients relevant for bias-subtracted adu counts, using the gains listed in the table.
5 - The MITLL2a and MITLL2 corrections are those derived from the FAST measurements (which tend to cover a larger dynamic range), and for the NONASTRO speeds are the FAST corrections converted to be appropriate for the gain of the NONASTRO mode.

Page last updated: 25 June 2007.