EEV2 Non-linearity with AAO1 & AAO2 controllers

EEV2+AAO2, AAO Lab tests. Data was acquired at the telescope for the EEV2 + AAO2 controllers during the commissioning of the new controllers in October 2005. However, of the four data sets available for EEV2+AAO2 in FAST (and two in NONASTRO), records kept do not indicate which ones actually correspond to the 'as used' clocks and voltages used with the EEV2 subsequently. Indeed, based on the bias levels in these exposures, I am not convinced any of the correspond to the as used system now on the AAT. So I have discarded them.
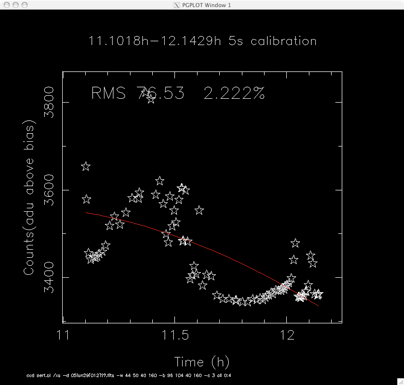
In some periods the lamp is just unstable, while in others it varies smoothly, meaning its output can be calibrated with a polynomial. The analysis code selects segements of data where the lamp is well behaved, and calibrates them onto a constant brightness. By making long sequences  that scan up and down in exposure time, I was able to span the full dynamic range of the detector several times. Indeed for speed FAST I repeated this sequence several hours later, and analysed all that data together, giving me confidence I am getting the same result several times.
Note that I also use the data sequence to measure the shutter 'dead-time' - that is the length of time one gets by extrapolating counts as a function of time back to a zero exposure. This represents the time it takes the shutter to open and close, in addition to the exposure time requested. In June 2007, this open-close time was 0.055+-0.001s. All exposures are corrected for this open-close time.
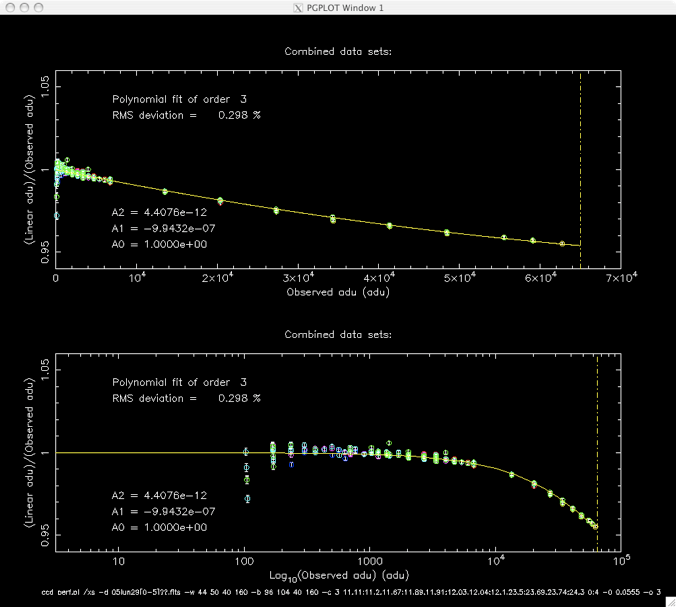
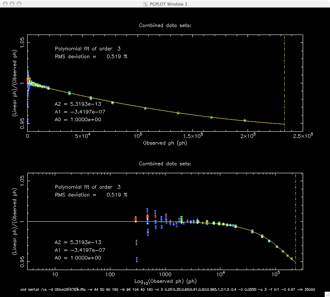
The resulting EEV2+AAO2+FAST data is plotted below, with a second-order polynomial fit plotted on top. The fit has its zeroth-order term fixed at 1.0, so there are actually only two free parameters. The uncertainties plotted reflect photon counting uncertainties, the uncertainty associated with the lamp calibration process, and the uncertainty associated with determining the lamp's count-rate. The figure shows these result in both linear and log forms (the latter shows better what happens at low count rates). The fit is the same in both plots and is a function of linear observed counts.

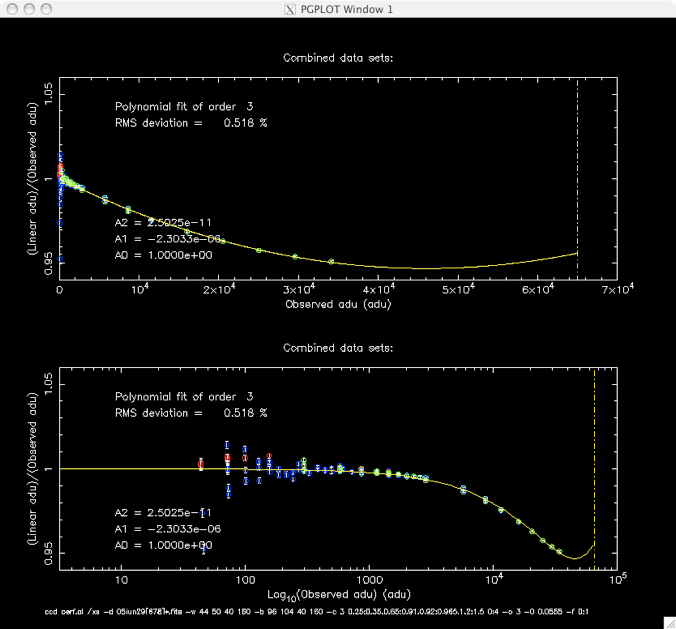
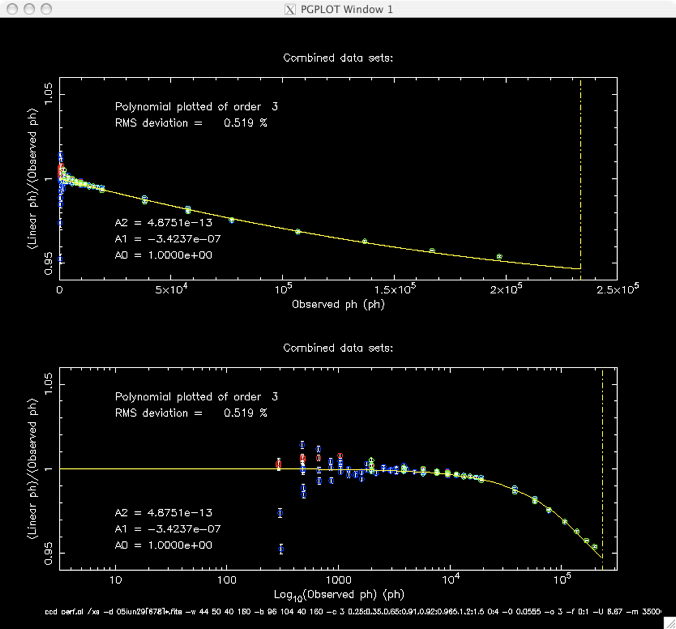
The resulting EEV2+AAO2+NONASTRO data is plotted below, with a second-order polynomial fit plotted on top. This fit (indeed all the fits plotted in this analysis) also has its zeroth-order term fixed at 1.0.

A question immediately springs to mind ... the form of these non-linearities looks quite similar. Are they really different, or is the non-linearity just a function of the nature of the silicon and the read-out amplifier in the detector? To examine this I have used the known gains of the two read speeds to plot non-linearity in both as a function of observed photons (rather than counts).
FAST
NONASTRO
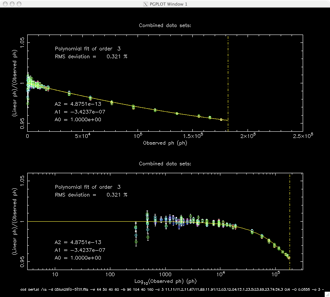

They indeed look very similar, and as a final test, if I plot the FAST photon non-linearity fit on top of the NONASTRO data, I get the following - a truly remarkable agreement given the data and the fit represent two completely independent measures of the same quantity. Given this FAST and NONASTRO data can be characterised with a single non-linearity correction. And data from both can be used to constrain the "master" correction. Recommended corrections for the EEV2 are provided at the end of this report.

EEV+AAO1+FAST on Telescope tests - 2 April 2001 (with RGO spectrograph). This data did not really probe the full dynamic range of the detector - while the longest exposure of 60s goes to ~60000adu, the shortest was only 1s and so probed only down to ~1000adu. However, the lamp was quite stable, and so a good solution can be derived in the dynamic range probed. The RGO shutter open-close time derived from this data set was 10ms.
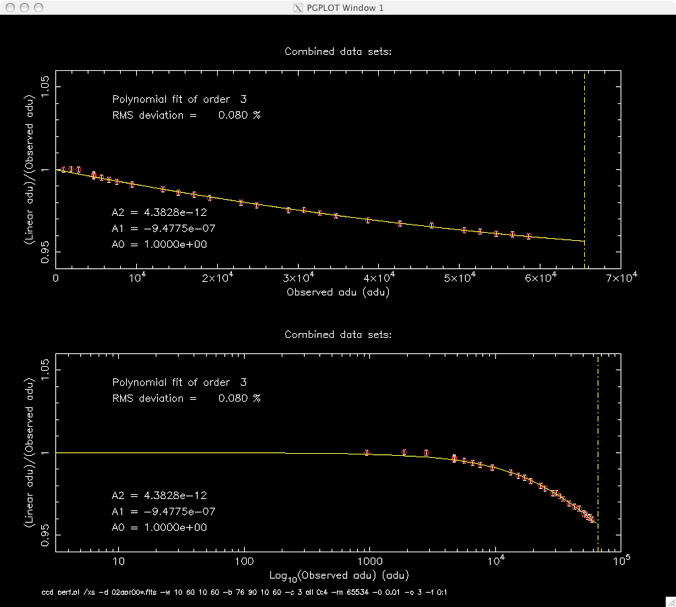

However, of even more interest is the question "Is the linearity solution with the AAO1 controllers the same as with the AAO2 controllers (modulo the different gains in use)?". To test this I did the sdame as above - plot the AAO1 data as a function of photons (rather than ADU) and overplot the fit I derived from the AAO2 controllers (as a function of photons). The agreement is remarkable.
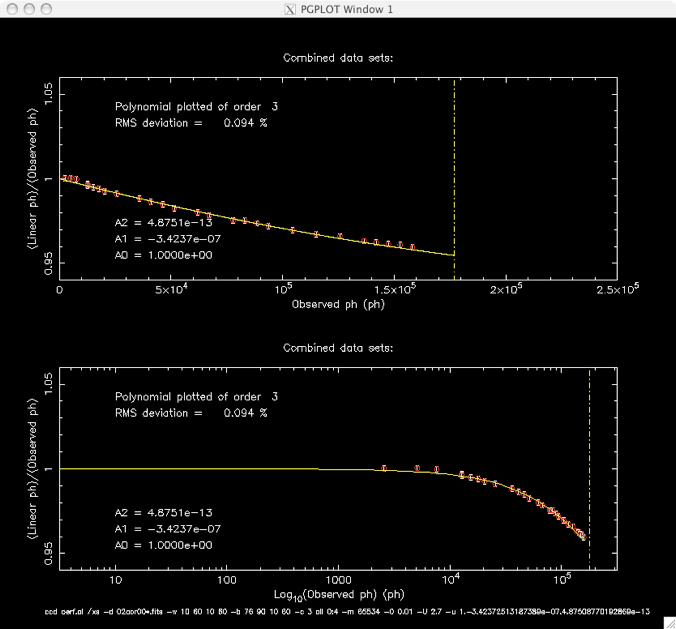

In summary then the linearity correction derived for the EEV2 detector (when parametrised as a function of photons detected, rather than adu detected) is independent of the controller or read speed used).

Last updated Chris Tinney 20 June 2007.