This site introduces a technique for measuring the resonance frequencies of the vocal tract quickly and non-invasively, during speech or singing, in nearly ecological conditions. We use it as a research tool, have used it in the past as a speech trainer and more recently to teach resonance tuning in singing. For measurements of impedance spectra and resonance bandwidths see here.
The principal use of the device is in measuring vocal tract resonances. (For the differences between resonances and formants see here.) The 'ecological' way uses a microphone and small sound source located at the lower lip. It is also possible, with suitable calibration, to use this software for measuring acoustic impedance spectra, but we concentrate here on the 'ecological' application.
An acoustic current is synthesised to give high resolution frequency information over the frequency range of interest. We first calibrate the system by making a measurement of sound pressure just outside the lips, with the mouth closed (pclosed). We then inject the same acoustic current into the vocal tract in parallel with the external field and again measure the pressure at the lips (popen). The ratio γ = popen/pclosed then shows the frequencies of the tract resonances.
.
This measurement of a man speaking the vowel in 'heard' shows two superposed signals. The γ = popen/pclosed ratio is the broad band signal, and the arrows show the resonances R1, R2, R3, R4. The harmonics of the voice are a frequences fo, 2fo, 3fo etc, with the 8th harmonic and above being hidden by the broad band signal. Notice that the fifth harmonic (5fo) falls close to R2, which gives it a boost in amplitude. The resonance provides impedance matching between the high impedance of the glottis and the low impedance of the radiation field at the lips.
The vocal tract behaves is an acoustic duct about 170 mm long, nearly closed by the vocal folds and open at the mouth. A cylinder, length L, closed at one end has resonances at f0 = v/4L , at 3f0, 5f0 etc, where v is the speed of sound. (See pipes and harmonics.) For such a cylinder the resonances would fall at frequencies of about 0.5, 1.5, 2.5, 3.5 and 4.5 kHz. The vocal tract shape varies as the lips and tongue are moved in speech. So here, while R1 and R4 fall close to the values for the cylinder, R2 is lower and R3 higher than for a cylinder.
From the broad band response we can determine the resonances
of the vocal tract, independently of the speech signal. The resonant frequencies are interesting for fundamental acoustical
phonetic research but, if we extract and display them immediately, they can be used to drive a cursor for speech training. This is how we do it in the real time version.
Schematic diagram. (a) shows the spectrum of the
speech signal alone. This male voice has harmonic partials
spaced at the pitch frequency 126 Hz. (b) The injected signal has frequencies spaced at 5 Hz, whose amplitudes are calibrated (in this case) using the radiation field outside the speaker's mouth. (c) The sum of the speech signal and the broad band signal (including the effects of the resonances) goes from the microphone to the analogue-digital converter. The speech signal is used to measure pitch and amplitude; then the harmonic components below 1 kHz are removed. (d) The resonances are detected from the remaining interpolated signal. Similarly, the broadband signals may be removed to leave just the speech harmonics. In the version of the device used for speech training, the resonance frequencies were used to position the cursor on the vowel plane (see below). Notice that the signal:noise ratio in these figures is worse than in the preceding figure. This is a consequence of making the measurements rapidly.
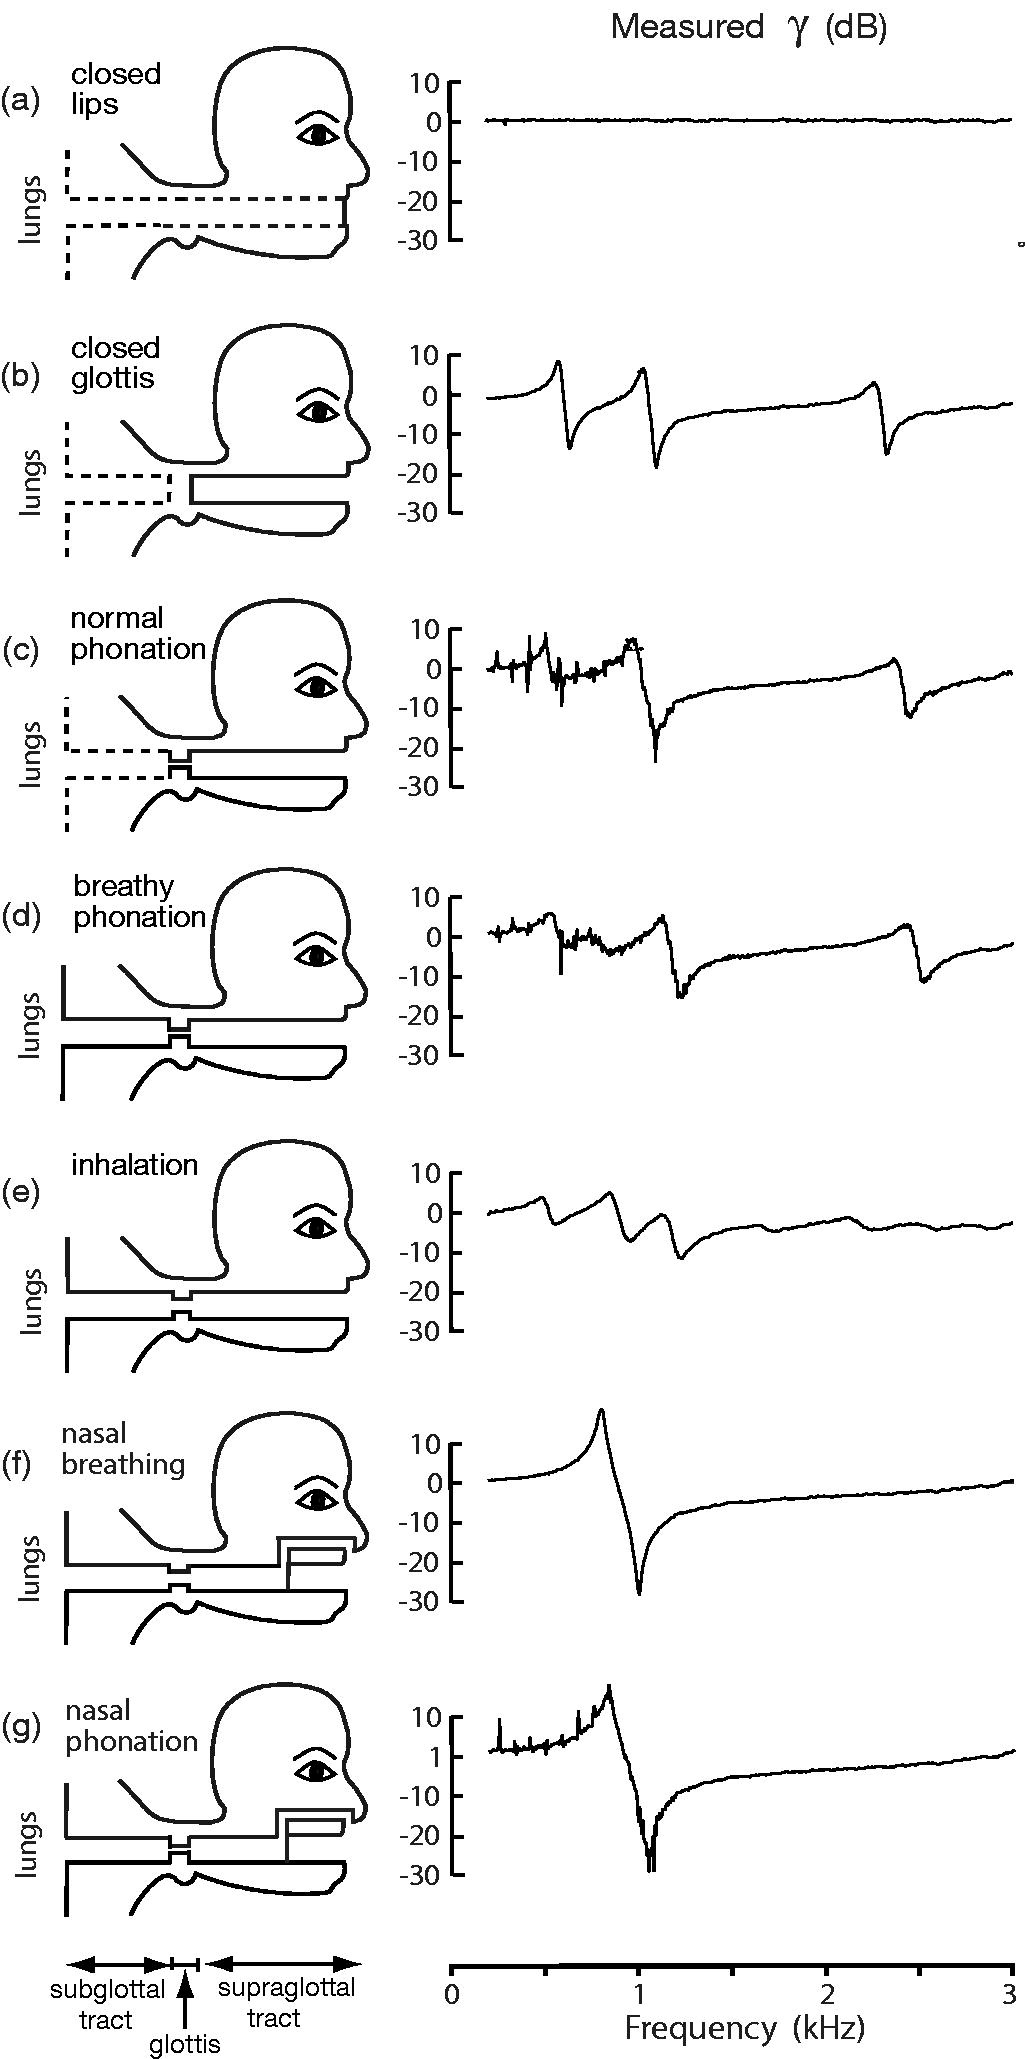
Examples of how measurements at the lips can identify different vocal tract configurations. The measured ratios
γ(f) are at right. The particpant produces seven different gestures. The schematics on the left are cartoon 1D models of the tract (not to scale and highly simplified). Notice that, for inhalation, the vocal tract and trachea are connected, which roughly doubles the length of the former. This means roughly twice as many resonances in a given frequency range. Some of the same effect is seen, for low frequencies, in breathy phonation. (Figure from Jeanneteau et al (2020) below.)
Garnier, M., Henrich, N., Smith, J. and Wolfe, J. (2010) "Vocal tract adjustments in the high soprano range" J. Acoust. Soc. America. 127, 3771-3780. Copyright (2010) Acoustical Society of America. This article may be downloaded for personal use only. Any other use requires prior permission of the author and the Acoustical Society of America. The preceeding article appeared in (JASA127, 3771-3780) and may be found at ( J. Acoust. Soc. America).
Donaldson, T., Wang, D., Smith, J. and Wolfe, J. (2003)
"Vocal
tract resonances: a preliminary study of sex differences
for young Australians", Acoustics Australia, 31, 95-98.
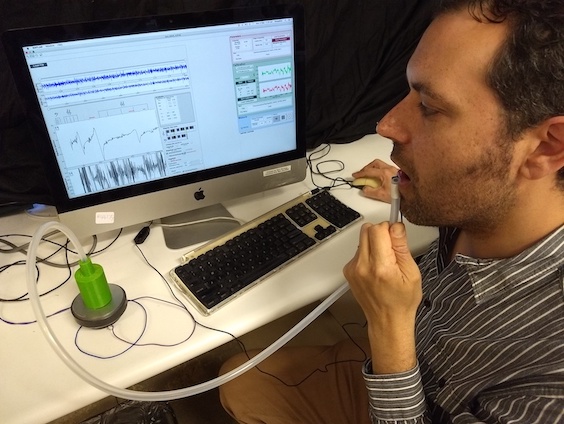
Using the resonance measurements as visual feedback
This photo shows Noel Hanna using the system, holding the flexible tube at his bottom lip.
.
.
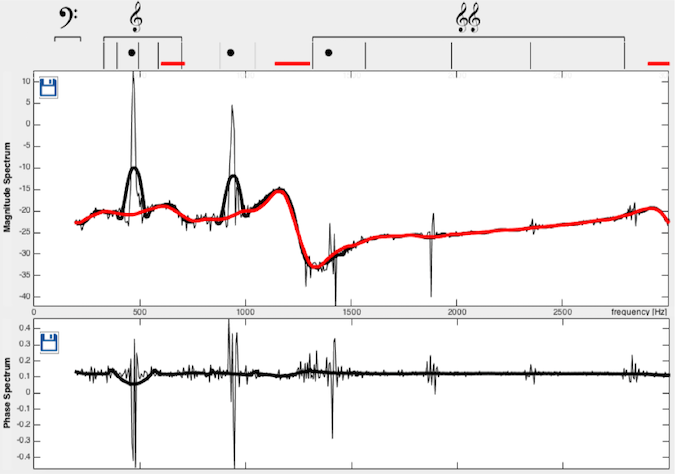
A screen grab of the feedback system. The sharp vertical lines on the graphs show voice harmonics, which are displayed on the musical staves as black dots. (The 'double treble clef' is the supertreble clef, two octaves
above the treble clef.) The peaks in the continuous line on the upper graph indicate the tract resonances. A description of the study using visual feedback is in
this paper
Hardware, software and training
The electronic hardware includes a sound card, a microphone (very high linearity and low sensitivity), a small audio power amplifier and a horn driver. You can download the .stl file for the adaptor that matches a horn driver to the hose used as a source. (The design software we used is Blender and the 3d printer was a Cubicon plus, but this should be of little importance.) The larger end is clearance diameter for a 1" thread so that plumbing tape can be used for a good seal. The hose we use is 9.5 mm OD, 5 mm ID and about 1 m long. None of these values are expected to be critical.
The software is available for download for Mac and download for Windows.
The software is in a compiled version of file written in Matlab. In principle, Matlab is not required to run it. The fig file is here but is also not needed to run the compiled version. The software may be slow to download.The software was written for a research project: it is not commercial software written by professional softward developers and it is not supported. Setting up the system, both hardware and software, requires considerable technical experience. It is not recommended as a home project.
The training used to learn R2 tuning is described in a journal paper here. Again, this is somewhat technical.
This soundfile is the note E6 sung with R2:fo tuning by a volunteer participant who has no formal singing training but who used the feedback mentioned above to learn R2:fo tuning. Using R2:fo tuning, she increased her comfortable limit from A5 to E6 (A below high C to E above).


 Vocal tract resonances from broad band excitation
 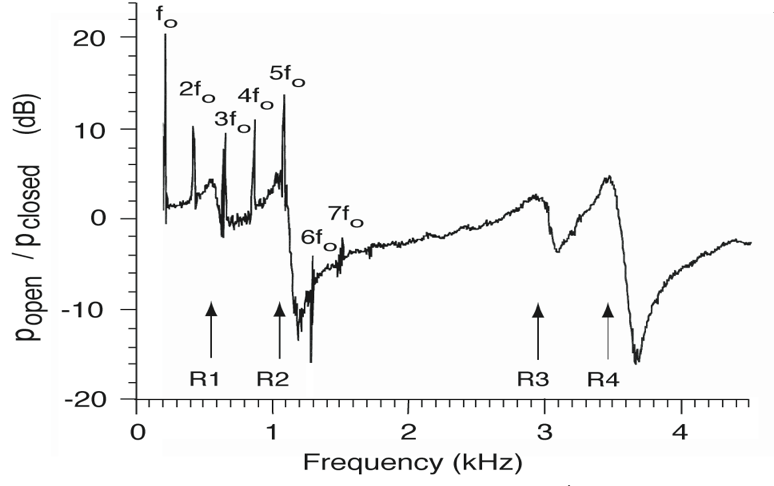 .
. 
 .
.  .
.