This is the first step when you launch the application. You have to enter a map by specifying a temperament, a type of scale and a number of octaves you want to work with.
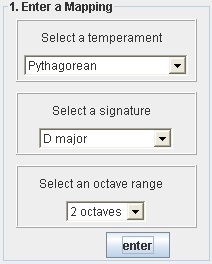
By using  you will obtain the table below. You are now able to see the results of the calculations and to edit the values.
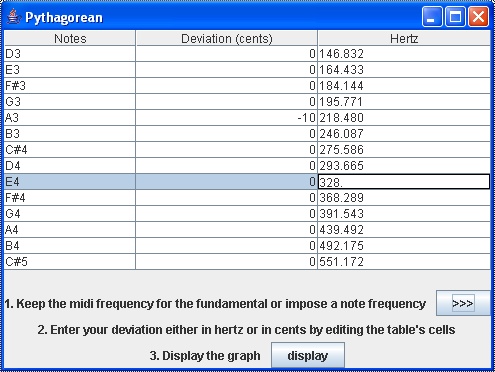
Notes column: The scale according to the type of scale and the number of octaves you have chosen.
Deviation column: It shows the deviation in cents. At first, all the values are set to zero.You can then give any values (integer or double precision) to customize the frequencies of your scale as shown for the note A3. The frequency value in Hertz will change according to the new deviation.
Frequency column: It shows the frequency in Hertz. The frequencies are calculated according to the pitch of the chosen fundamental set according to equal temperament at A=440 Hz and the values in cents of the selected temperament (here the fundamental is D3 and the temperament is Pythagorean) . You can also change any frequencies to customize your scale as shown for the note E4. The deviation in cents will change according to the new frequency value.
By using  you display the panel below, which allows you to impose a frequency for any single note in the scale and obtain the selected temperament with respect to that note. All the frequencies will be calculated according to the new value. All the deviations will be reset to zero.
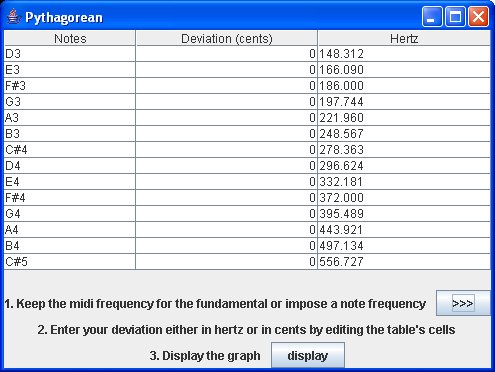

(Just choose a note in your scale and enter a new frequency in Hertz. Then submit.)
Here for example we want F#3 at 186 Hz instead of 184.144 Hz for our Pythagorean temperament. After submitting, we obtain the new table below.
Of course, you can still change the values by editing the table's cells. You now display the graph by using 
Assume we have entered this following map (see the section above).
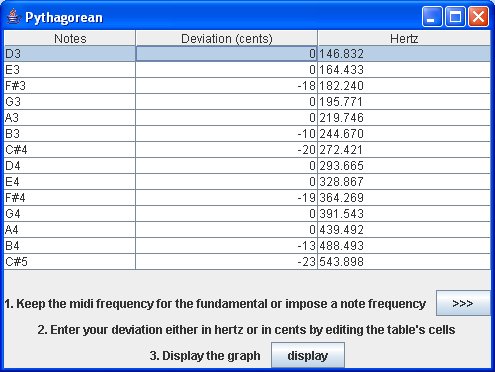
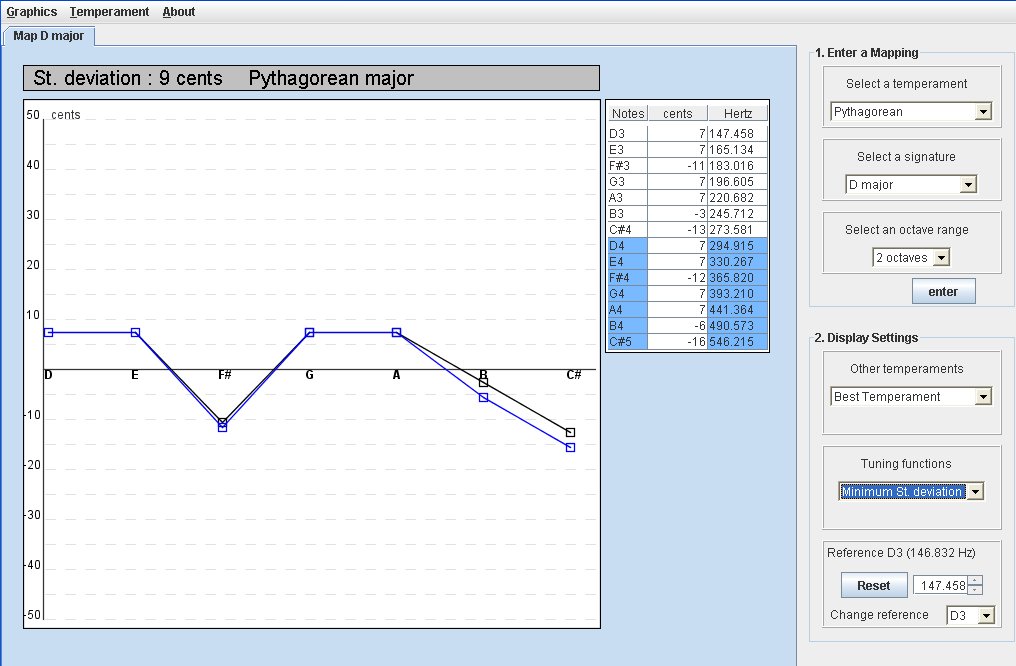
If we display the map, we get this kind of interface (see below). All the values are stored in an editing value table. The cents values in this table correspond to the deviation in cents on the graph.
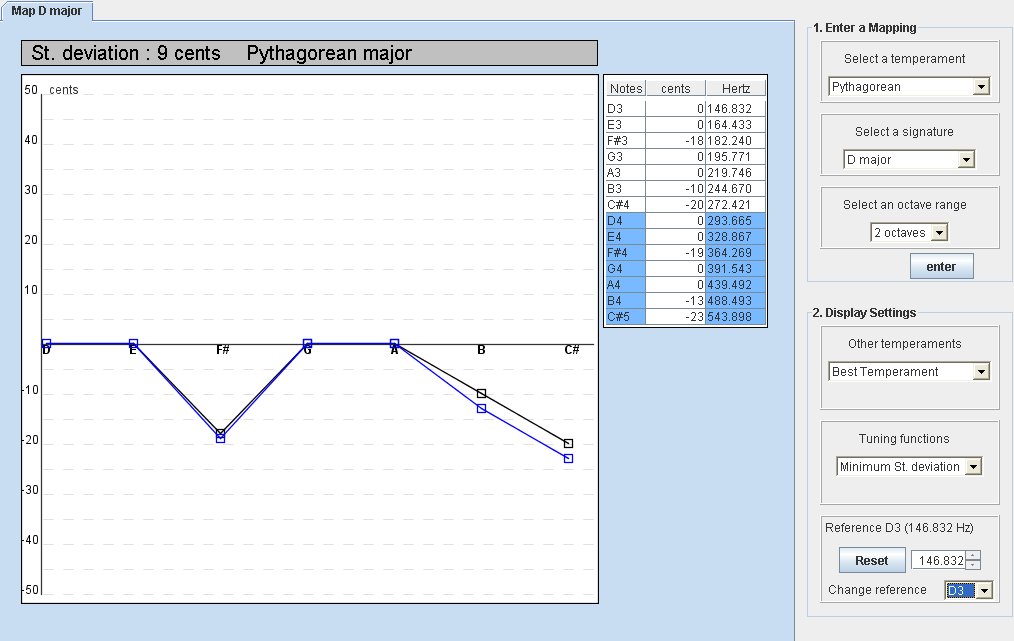
Now you can use on this graph all the functions provided in the "Display Settings" panel. See the following sections chapters. But first you have to know how to interpret those graphs and tables.
This application displayed two kind of graphs. We can distinguish them by reading the tabs. When the tab indicates " Map D major" for instance, it means the graph is displaying a map you entered previously. When the tab doesn't specified that it is a map, it means that the graph is the result of a function applied on a map (the map's name is specified on the tab). It is important to know how to interpret them.
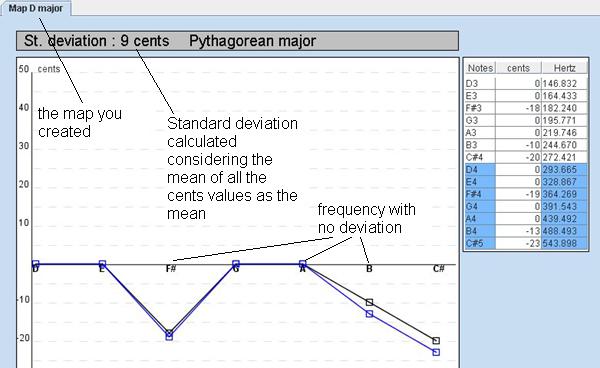
Graph of a Map:
That is how it looks like when you enter and display a map. The X axis represents the Pythagorean major temperament.
The frequencies in the value table include already the cent deviation. So here the frequency values represent the curves.
The curve in black represents the first octave. The second octave is displayed in blue. If your octave range include a third octave it will be display with a red color.
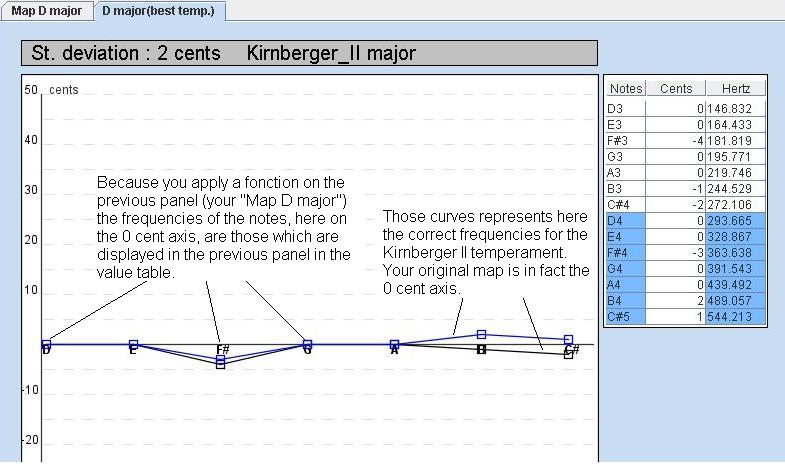
Graph when a function is applied on a map:
This kind of graph is displayed when you applied a function on the map your entered (here "Map D major").
So now the X axis represents the temperaments your entered in the map. It means that each note on the 0 cent axis has the same frequencies as it had in the map.
The curves represents the new temperament, here Kirnberger II.
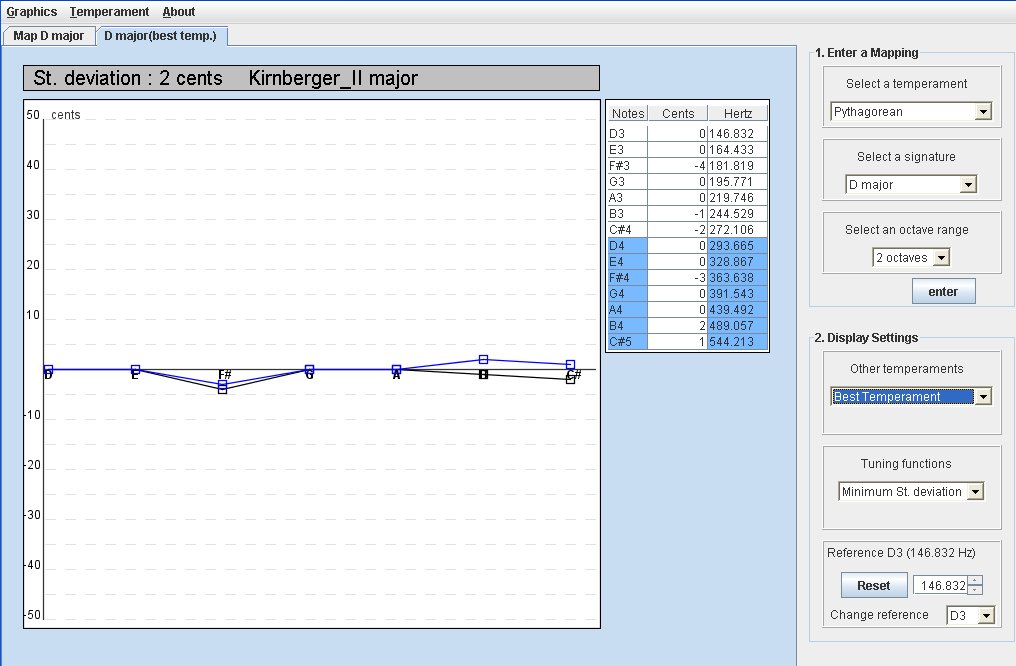
By using the function "Best Temperament" in the section "Others temperament" in the "Display Settings" panel you can display a new graph which shows you the best temperament for your map. The algorithm calculates the best temperament by determining the minimum standard deviation considering all the temperaments in the database (see the temperament tables).
Here with see an example where the best temperament is Kinberger II. The standard deviation is only 2 cents.
You can also display your map with another temperament. Choose the temperament you want in the section "Other temperament".
By using the function "Minimum St. deviation" in the section "Tuning functions " in the "Display Settings" panel, you will shift the graph in order to have the minimum standard deviation for your map considering the 0 cents axis as a mean. In other word, it tunes the reference pitch up or down so as to give the least standard deviation with respect to your chosen temperament. (Suppose, for example that you found an historical wind instrument and could work out its playing pitches. With what tuning would it be most in tune ?). See an illustration of this function in the first example.
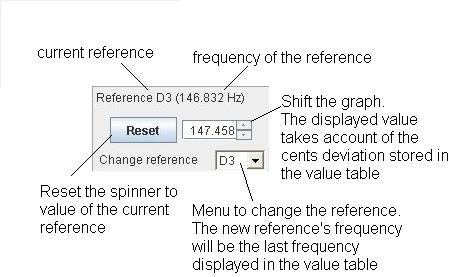 This spinner allows you to shift the graph by step of 0.05 Hz. All the values are updated according to the shift. This way you can easily change your range of frequency.
In addition, you can choose the note you want to do the shifting. For instance, if you want to know how the graph and the values look like with a different A4 pitch, just choose A4 note in the change reference's menu. The current reference will be updated according to the new name of the reference (here A4) and the new frequency (the value currently display for A4 in the value table).
The reset button allows you at any moment to retrieve the former position of the graph. The spinner value will display back the frequency of the reference.
If you shift the graph and then set a reference (even the same reference), you will not be able to retrieve the first position of the graph since it will be the new position now registered as a reference. Make sure this is what you want or use the reset button before setting a new reference.
What is in the menu... ?
Graphics functions
With the function "Duplicate the active graph" (Alt+U) you can create another page with the same graph and value table. This way you can make change on the new page and keep the former one as the reference. A star (*) indicates you that this page is a duplicata.
With the function "Delete the active graph" (Alt+D) you are able to remove any page on your application.
Temperament tables
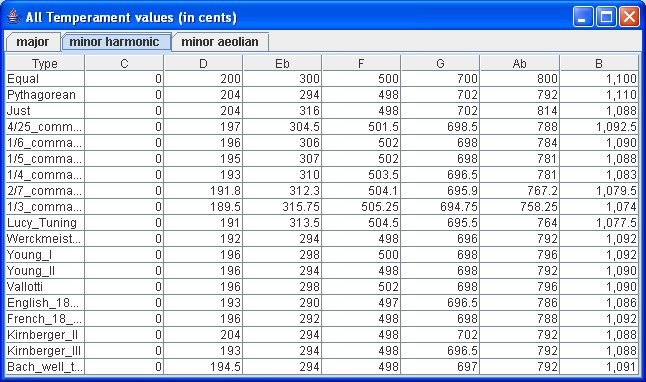
With the "See temperament tables" (Alt+T+S) you can check the values that are used in this application for all the temperaments and all the type of scales.
Examples
Suppose your keyboard (clavichord, harpsichord, epinette or your midi synthetiser) is tune with a Vallotti temperament with A4 = 443 Hz. You would like to play a tune in E minor on your keyboard. The tune was originally written for a different temperament. You suppose it is the same temperament as Bach used for the "Well tempered keyboard" (Bach's WohleTemperirt rediscovered by Kellner).
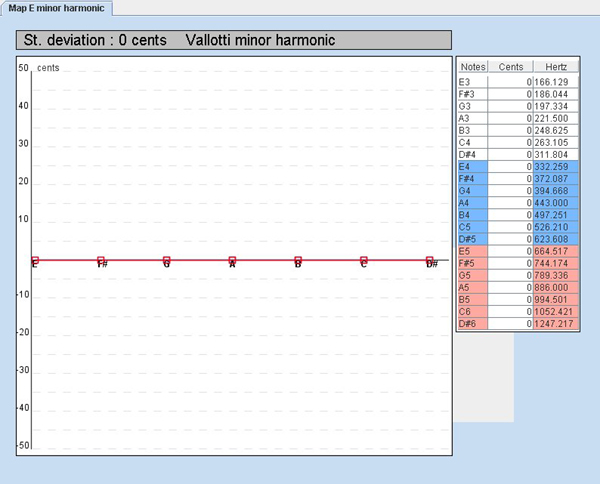
First you entered your parameters in the first panel (temperament: Vallotti, scale: E minor harmonic, octave range: 3). You will get the following map:
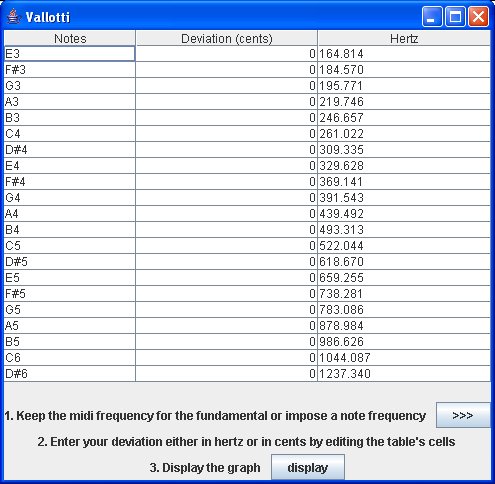
As you see you get your Vallotti temperament but with a pitch A4 = 439,492 Hz. (Because this application considered the midi value frequency of the fundamental, here E3, and then apply the temperaments, here Vallotti temperaments).
First click  in order to be able to impose a note frequency. You will display the window below:

Choose A4 and enter the new frequency 443 Hz.
You have now the table with the correct Vallotti temperaments and the right pitch.
Now display the new table and in the section "Other temperaments" (in the "Display Settings" panel) choose the temperament you want, here the Bach well tempered temperament.
Below the first panel represents your first click on the display button.
The second panel comes after your apply the Bach well tempered temperament.
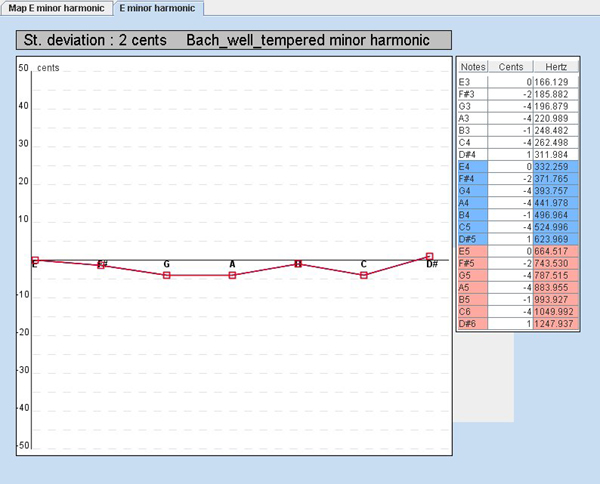
Let's the value table of the second panel closer.
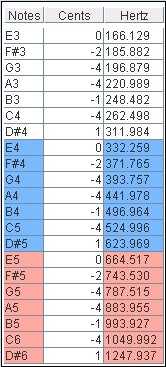
The "Hertz column" gives you all the correct frequencies for your temperament. The "cents column" show you the deviation between the two temperaments. It could represents the adjustement you have to do to set up your keyboard with new temperaments. For instance, in order to get the right pitch in Bach well tempered temperaments for A3 on your keyboard, you must lower it by 4 cents.
You now have two options to tune your keyboard: by ear or by using an electronic tuner.
Doing it by ear, you don't need this application but you will need either to turn to a tuning expert or to know about tuning techniques. There is a wealth of literature on this subject (methodology, instructions, schemes and historical temperament tables).
Doing it with an electronic tuner, you will first need to have you own. There are a wide variety of tuners available. Cheap ones should be avoided. You can still use for a resonable price the Korg OT-12M (reasonably accurate to about one cent) or the Peterson Strobe Tuners (highly accurate to 1/10th of a cent).
Using those kind of tuners, you can now either use the frequency values or adjust you keyboard frequency according to the cents values.
Since we tune or keyboard in a minor key, we could do the same job again to get the value table for a minor aeolian scale and this way have the frequency for D. In a later version, this application would implement all modes or chromatic scales in order to have a full range of note when tuning.
Let assume that we work on an old wind instrument and we don't know what temperament it has been tuned with and that we have no idea of the A4 pitch reference at this time.
We play on the instrument a minor harmonic scale on one octave and we collect all the deviation in cents. We use, for that purpose, an electronic tuner in equal temperaments with an A4 reference of 440 Hz. Here are the values collected during the experiment:
Notes |
D3 |
E3 |
F3 |
G3 |
A3 |
Bb3 |
C#3 |
Tuner frequency (Hertz) |
146.83 |
164.81 |
174.61 |
196 |
220 |
233.08 |
277.18 |
Deviation found (cents) |
-30 |
-33 |
-37 |
-31 |
-32 |
-40 |
-39 |
Using the application we create a map choosing equal temperament, D minor harmonic scale and one octave range. We don't need to impose a note frequency because the frequencies are already correct. We used a electronic tuner with A4 = 440 Hz as reference and equal temperaments (midi frequencies) and remember that the application takes the midi frequency for the fundamental and apply the corresponding temperaments (here equals) in order to create the first table (below). Here are the maps:
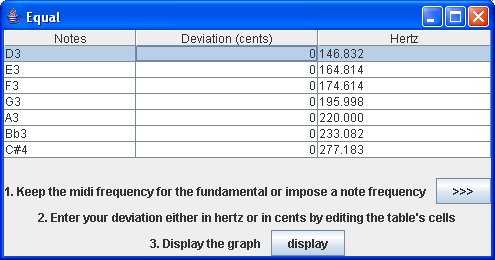
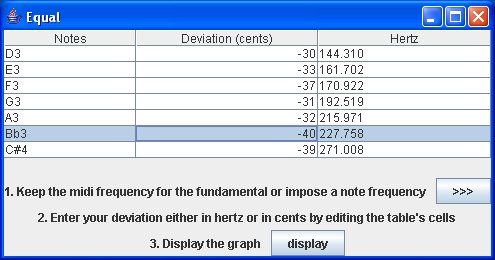
Now we have completed the map (right map) we can display it and find the best temperament (note that each frequency has been updated according to the deviation).
The first panel shows what it looks like displaying our map. The second panel is displayed after applying the "Best Temperament" function.
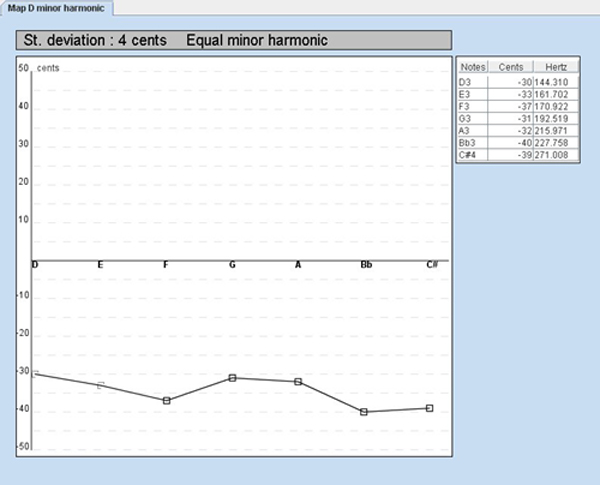
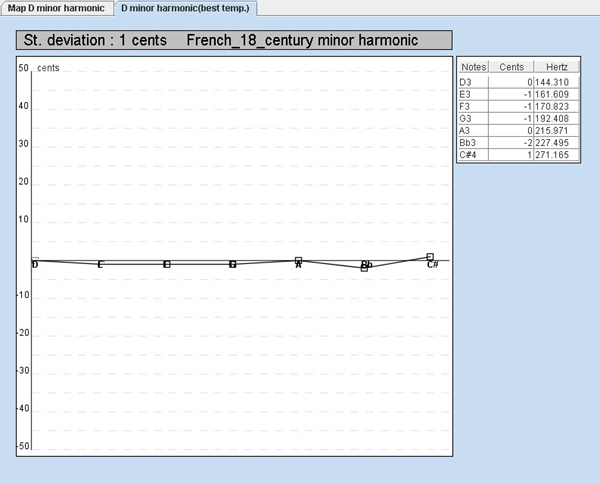
The best temperament for this wind instrument seems to be a French temperament of the 18th century as shown on the second panel.
Let's see more of the value table.
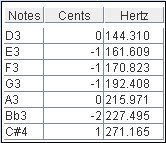 The "Hertz column" shows all the correct frequencies for the French temperament of the 18th century.
The "cents column" shows the deviation between the correct temperaments and the temperaments of our instrument.
For instance, it means that the E3 of our instrument is 1 cent below the correct frequency of the 18th French temperament. We also see that 2 notes are correctly tune : D3 and A3, and the others are however very well tuned.
By using the tuning function "Minimum St. deviation", we can determine the best configuration for the tuning.
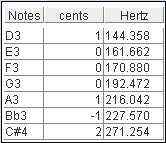 That way we get the less deviation for each note. Of course a wind instrument is not a keyboard and we can't change the tuning for a given note. But we can tune the overall by moving the position of a tuning slide.
So if it is possible with our instrument, we could tune it with D3 at 144.358 Hz (playing and moving the tuning slide using our electronic tuner) and this way we would have a best overall tuning.
We can also determine a pitch. This instrument has a reference A3 = 215.971 Hz. We can affirm that the A4 reference for this wind instrument is 432 Hz.
If we edit the temperament tables we can check the cents values for the 18th French temperament and then by adjusting them with the cent values (considering the first value table) we obtain the temperament of the wind instrument.
Notes (with a C scale) |
C |
D |
Eb |
F |
G |
Ab |
B |
French 18th temperament(cents) |
0 |
196 |
292 |
498 |
698 |
788 |
1092 |
Our wind instrument temperaments (cents) |
0 |
197 |
293 |
499 |
698 |
790 |
1091 |
The larger the temperament's database, the better the estimation of a temperament. What is more, our example was considering a minor harmonic scale in a one-octave range. For better results, we could tie up several estimations by adding other scales and also increase the octave range when we are collecting the measurements on the instrument.
Any questions or feedback to simon.caplette@enst-bretagne.fr


 The "Hertz column" shows all the correct frequencies for the French temperament of the 18th century.
 That way we get the less deviation for each note. Of course a wind instrument is not a keyboard and we can't change the tuning for a given note. But we can tune the overall by moving the position of a tuning slide.