Harp Acoustics
Florent Gant, a visiting student from France, studied the harp using a finite element analysis method, and was able to make some comparison with experimental work carried out by fellow student Sebastien Lemasle
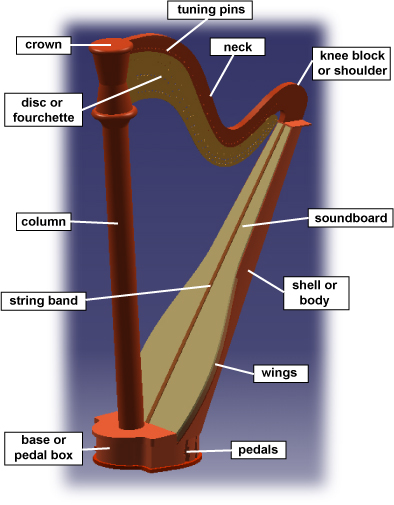
Marjorie Maydwell, harpist, contributed by playing comparisons on two different harps: her own harp and a harp from Hugh Jones.

 You can hear Marjorie Maydwell playing You can hear Marjorie Maydwell playing

 Marjorie Maydwell playing Marjorie Maydwell playing
Sound spectra of two harps
  Marjorie's harp glissando Marjorie's harp glissando
  Hugh Jones harp glissando Hugh Jones harp glissando
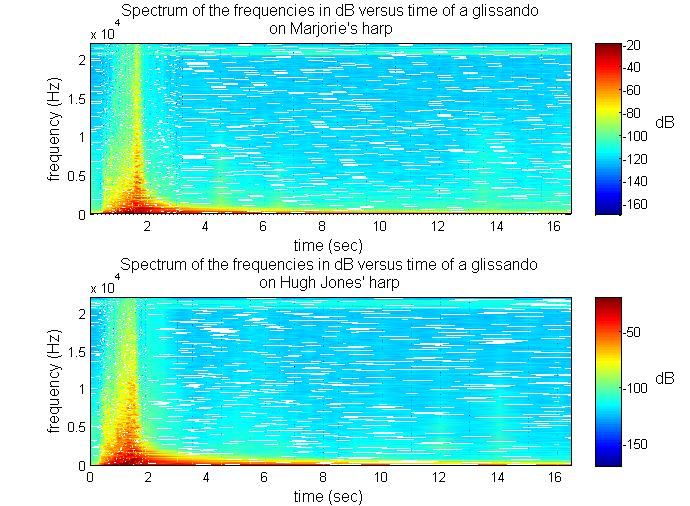
Sound spectra of a glissando of two harps measured similarly. The The glissando finishes within 2 seconds, and the harp is left to resonate. Notice that the shape of the two spectra is much the same. The
high frequencies disappear faster than the lower and that the decay
is very slow for the fundamentals up to 200 Hz. These two graphs show
us that it is from around 5000 Hz that the decrease of the intensity is the
fastest. We see also that the values of the amplitude for the Hugh Jones
harp are a bit higher than Marjorie's harp. This could be due to the different
radiation pattern of sound for each harp. Depending on the position of the
microphone in comparison to the harp, the intensity of the sound can vary a
lot in the surrounding space. However, Hugh Jones' harp is clearly louder at
all positions.
Soundboard modes
Chladni
patterns |
|
|
animation |
|
|
|
Experimental
frequency
(Hz) |
202 |
427 |
Modal
frequency
(Hz) |
227 |
395 |
Chladni
patterns |
|
|
animation |
|
|
|
|
Frequency
(Hz) |
537 |
587 |
Chladni
patterns |
|
|
Frequency
(Hz) |
662 |
771 |
Chladni patterns were calculated for a harp soundboard. The results gave these shapes on the sound
board for the different modes of vibration up to 1000 Hz. The frequencies of the experiment are also listed.
Experiment found two modes of vibration that look like modes found
with the model. The shapes of these first modes are almost the same, but
the frequencies do not correspond well. This result may be due to
the homogenisation made but may also be due to uncertainties in the
mesh used for calculation and properties of the soundboard, especially those of the carbon composite.
The animations of the modes of a harp soundboard were calculated using CASTEM finite element analysis. The animations show a harp soundboard, clamped at the edges, in a free resonance.
Dynamic mass spectra
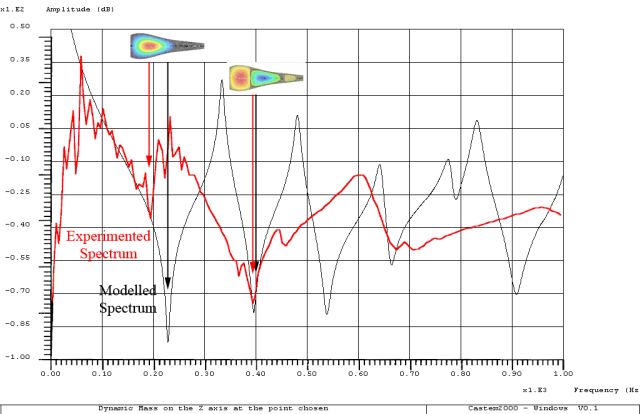
In this figure we can see the comparison between the experimental and the modelled spectra up to 1000 Hz at the same point on the soundboard. We observe that the model shows more resonances and anti-resonances than the experiment. This can be due to the decrease of the amplitude of the excitation of the shaker used to physically vibrate the soundboard as the frequency is increased. Also notice that all the modes found with Chladni patterns appear on the calculated spectra except the mode at 807 Hz where the point of excitation and measurement is located at a node of the mode. Also, the modelled results have modes with higher frequencies than the experimental modes for these spectra.
Decay time
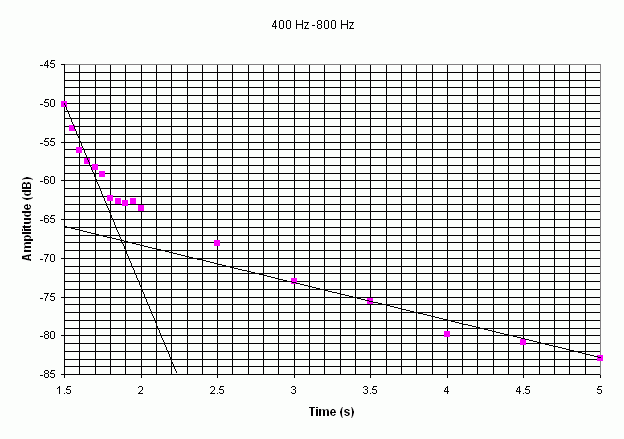
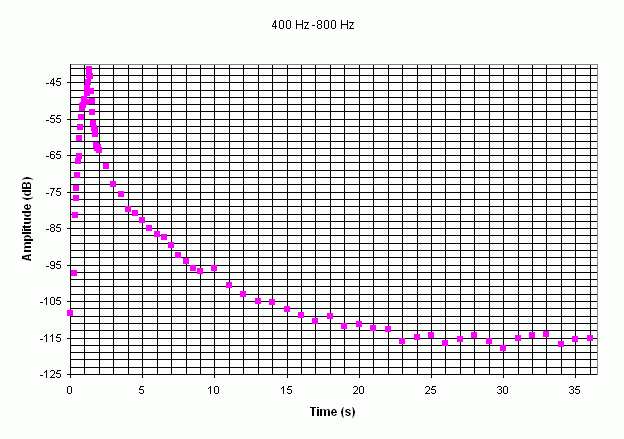
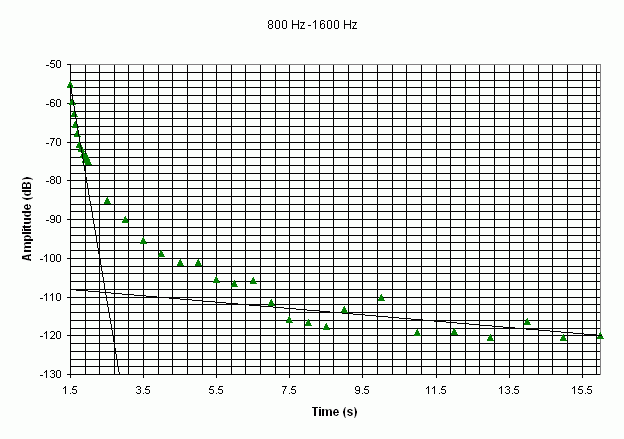
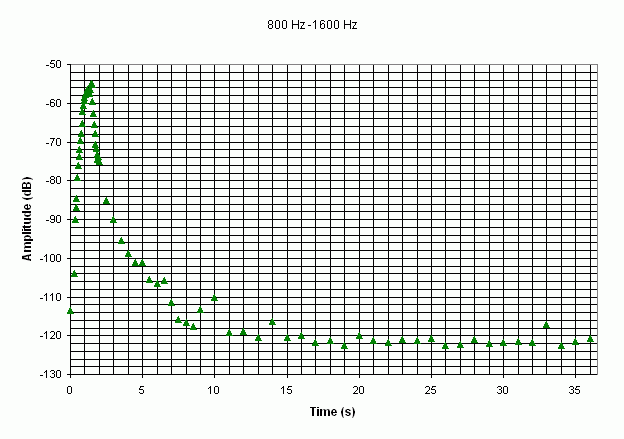
For a damped oscillator, the amplitude can be given by x0.e-αt, and the decay time is given by τ = 1/α. Examples of graphs showing the decay over the range of frequencies are shown in the figures above.
Two different slopes can be observed for each graph. The first slope commences at the origin and the other is the slope of the asymptote. Assume that this is the response of two systems: the first slope will define the decay of the first system and the second slope will define the decay of the second system. The decay time can also be calculated for each system, and this parameter decreases quickly over the range of frequencies for the first system, while it seems to decrease much more slowly for the second system.
These figures emphasise the fact that the higher frequencies decrease more quickly than the lower.
| 
