An experimentally measured Source-Filter model
This page is an appendix to the paper: "An experimentally measured Source-Filter model: glottal flow, vocal tract gain and radiated sound from a physical model," Wolfe, J., Chu, D., Chen, J.-M. and Smith J. (2016) Acoust. Australia, 44, 187–191. A version of Figure 1 from the paper is reproduced here. It is freely available for teachers and authors to use, with attribution.
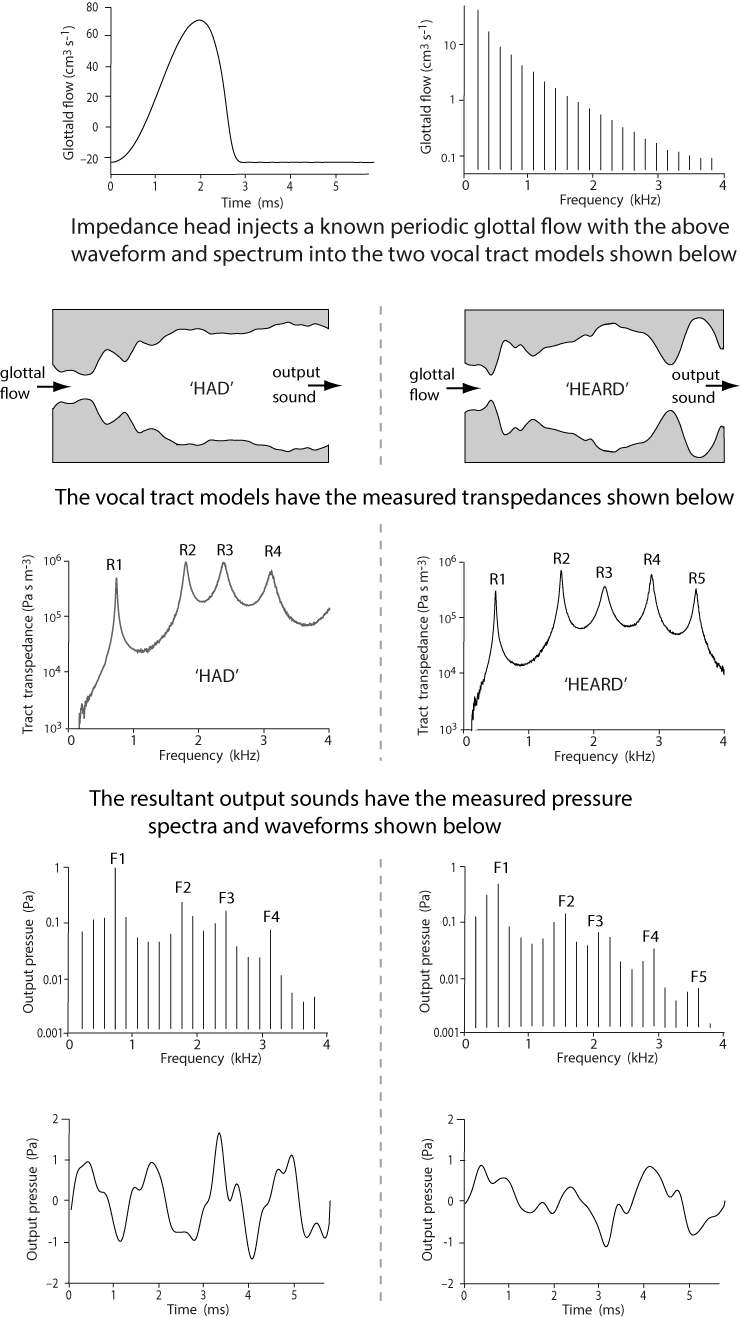
The top row shows the known acoustic current that was injected into a physical model vocal tract (time domain at left, frequency at right). The second row represents two physical models made with two reported area functions. The next row shows the experimentally measured transpedance: the ratio of output pressure at the 'lips'
to the current at the 'glottis'. The fourth and fifth rows respectively show the output pressure signals at the lips, in the frequency and time domain.
"An experimentally measured Source-Filter model: glottal flow, vocal tract gain and radiated sound from a physical model," Wolfe, J., Chu, D., Chen, J.-M. and Smith J. (2016) Acoust. Australia, 44, 187–191.
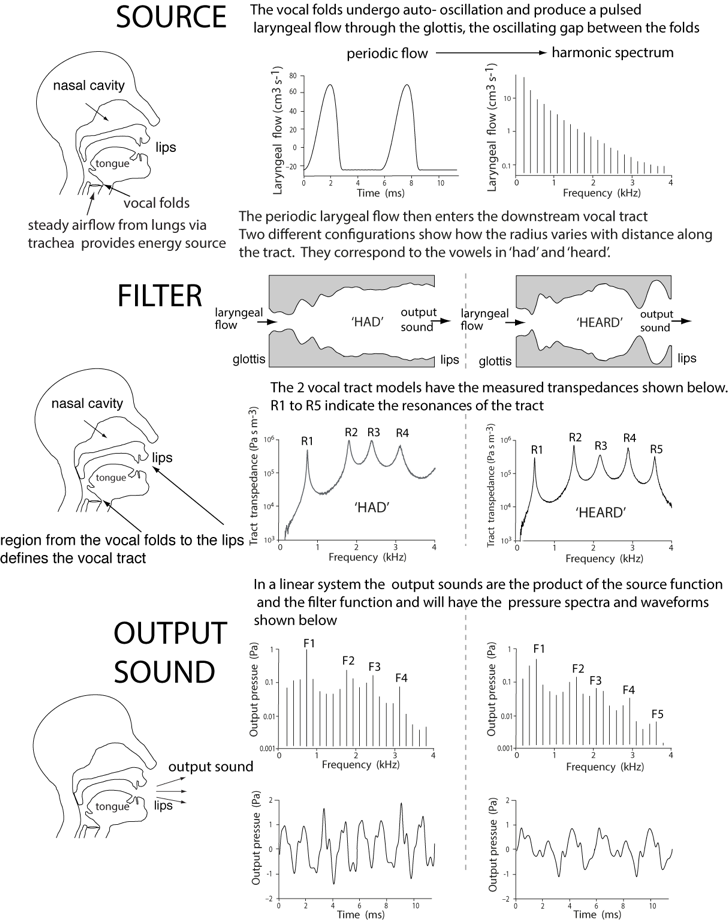
An alternative figure is below.
Click on diagram for a higher resolution version.
|