French vowels
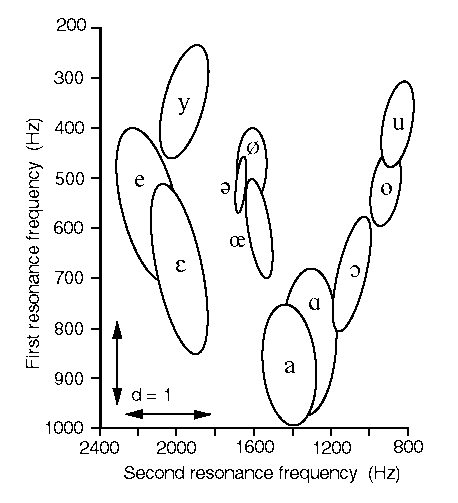
The vowel plane for production

The vocal tract resonances (R2,R1) for seven adult female
native speakers of French. The centre of each ellipse gives
the mean values ([R2],[R1]). The major axis of the ellipse
is parallel to the regression of R1 on R2, and the semi-axes
are the standard deviations in those directions. The graph
shows the unit of separation d between two vowels a and b
defined (Dowd et al, 1997) by
d = ((R2a - R2b)2 + (R1a
- R1b)2)1/2
The relative sizes of the vertical and horizontal axes have
been adjusted so that d has the same length in all directions.
As is common practice in plotting formants, the direction of
the axes is inverted, with the origin at the top right, in order
to make the relative positions of the vowels the same as in
conventional diagrams of the articulatory plane. The vowel /i/
and the nasalised vowels have been omitted.
. . . . . . . This study. . . .
.Pham Thi Ngoc. Review of Garnier-Rizet
vowel . R1 .(s.d.) . R2 .(s.d.) . . R1 . R2 . . F1 (sdm)
F2 (sd of means)
pie . . . . . . . . . . . . .. . . 351 . 2384 . 277 (27)
. 2321 (157)
thé . . 550 .(90) . 2150 (210) . . 391 . 2304 . 386 (37) .
2188 (171)
paix. . 680 (150) . 1990 (170) . . 560 . 1924 . 524 (45) .
1917 (117)
patte . 870 .(90) . 1420 (180) . . 697 . 1323 . 756 (76) .
1391 (78)
pâte. . 830 .(70) . 1320 (190) . . 652 . 1198 . 777 (87) .
1234 (110)
pote. . 690 (100) . 1090 (110) . . 566 . 1056 . 571 (55) .
1138 (101)
pot . . 520 .(40) . 0920 (100) . . 419 . 0803 . 450 (62) .
0853 (82)
poux. . 390 .(60) . 0860 (110) . . 364 . 0708 . 279 (21) .
0811 (51)
pu. . . 350 .(70) . 1960 (160) . . 363 . 1946 . 300 (47) .
1863 (91)
peu . . 470 .(50) . 1610 .(90) . . 426 . 1545 . 453 (64) .
1561 (59)
peur. . 600 .(90) . 1580 .(80) . . 576 . 1591 . 526 (66) .
1445 (100)
te . . 510 .(50) . 1670 .(30) . . - .
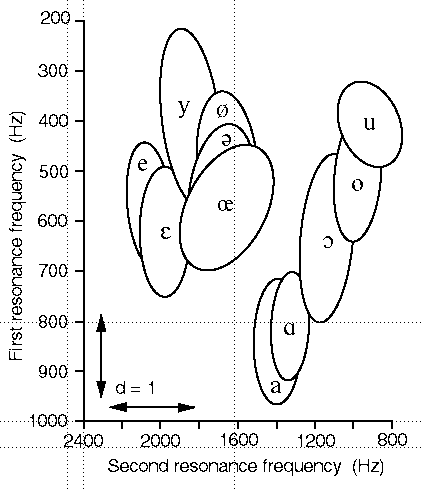
The perceived vowel plane

Perceptual categorisation of vowels. Twelve native French
speakers listened to a large set of pronounced vowel sounds
and classed (categorised) them as the vowel they most resembled.
The centre of the ellipse for each vowel is at ([R2],[R1]),
the mean values for all of the sounds that were identified
as most closely resembled. The major axis of the ellipse is
parallel to the regression of R1 on R2, and the semi-axes
are the standard deviations in that direction and in the perpendicular
direction. At lower left, two lines show the unit of separation
d defined above.

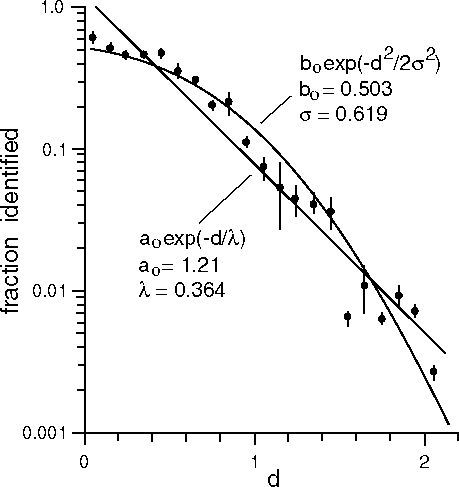
The fraction of identifications (particular sounds identified
as vowels) as a function of the separation d between the particular
sound (R2,R1) and the average for the perceived vowel ([R2],[R1]).
d is defined by Equation 1. The vertical axis is logarithmic
and the error bars are +/- one standard error. The straight
line is the best fit to an exponential function (r = 0.98)
and the curve is the best fit to a Gaussian function (r =
0.98).
References
Dowd, A., Smith, J.R. and Wolfe, J. (1998) "Learning
to pronounce vowel sounds in a foreign language using acoustic
measurements of the vocal tract as feedback in real time".
Language and Speech, 41, 1-20.
Epps, J., Smith, J.R. and Wolfe, J. (1997) "A novel instrument
to measure acoustic resonances of the vocal tract during speech"
Measurement Science and Technology, 8, 1112-1121.
Epps, J., Dowd, A., Smith, J.R. and Wolfe, J. (1997) "Real time measurements
of the vocal tract resonances during speech" Eurospeech'97
(conference proceedings, Rhodes), 721-724.
Garnier-Rizet M. (1994). Élaboration d'un module de règles phonético-acoustiques
pour un système de synthèse à partir du texte pour le français.
Doctoral thesis, Université de Paris III.
Pham Thi Ngoc, Y. (1995). Caractérisation acoustique du conduit
vocal: fonctions de transfert acoustiques et sources de bruit.
Doctoral thesis, Institut National Polytechnique de Grenoble.
Wolfe, J. " An introduction
to the acoustics of the vocal tract" Web document with sound
files
This research by Annette Dowd, John Smith and Joe
Wolfe is reported more fully in the first paper listed above.
|

